01
Executive summary
A steady quarter for treatments, with September asking a question.
Your team completed 134 treatments across the quarter and your Maps listing kept the phone ringing. September brought fewer new patients than July and August, and more enquiry records remain open — reviewing their outcomes is the clearest next step.
Biggest WinPatient Growth
134 treatments were completed across the quarter.
July closed 46, August 54 and September 34, with $74,908 of treatment value recorded in your system. August was your strongest month for completed treatments.
Website DiscoveryMore Visitors
Your Maps listing did the heavy lifting.
Listings-driven enquiries made up 71% of new enquiries (133 of 188) and 92% of calls came through your listing number. You currently sit at #1 on Google Maps for “dentist Windsor” with a 4.9 rating from 308 reviews.
Enquiry Follow-UpMain Opportunity
188 enquiries were recorded — 109 are still open.
Your enquiry system recorded 83 in July, 49 in August and 56 in September. Most new faces arrive through your listing, so a short weekly review of the open records can confirm booking and contact status, then identify anyone who needs follow-up.
Moving ForwardPrimary Focus
September needs a closer look.
September welcomed 25 new patients — half of September last year (50) and the lowest month in your 2024–2026 records — while 48 September enquiry records remained open. The demand signals are still there; reviewing booking outcomes and follow-up status is the opportunity.
02
What we learned
What held firm, and what changed in September.
Completed treatments stayed strong through August, your listing kept calls coming, and your team answered nearly every call. September brought fewer new patients and fewer ad clicks at the same spend — so the next steps focus on enquiry follow-through and where your ad budget works hardest.
Patient Momentum2026 Trend
July and August held steady; September dipped.
New patients held at 41 in both July and August, then eased to 25 in September (against 50 last September). January–September 2026 totals 380 new patients. The full history sits in section 03.
High-Intent SearchGoogle Ads
Google search ads produced 94 recorded actions across the quarter.
July recorded 35 actions, August 34 and September 25. The average cost per action was about $86 in July, $82 in August and $117 in September, as clicks eased while spend stayed flat. These are advertising actions — appointment requests and call actions — not confirmed new patients.
Where Visits Came FromSearch & Social
Social ads kept people tapping through, then scaled back.
Meta ads sent 2,624 link clicks to your website (1,362 in July, 1,047 in August, 215 in September) as spend eased from $468 to $70. These campaigns are built for local visibility and website visits rather than direct enquiries.
Area To WatchFrom Enquiry to Appointment
Nearly every call was answered.
Your team connected 477 of 488 calls (98%), with 11 missed across the quarter. Because older phone records fall outside the available history, we report 334 distinct callers rather than a first-time split.
03
New patient numbers
Steady through August, with September softer.
The clinic’s new-patient tracker gives us the clearest view of patients welcomed into care. The cards below put the quarter in context, while the historical figures help us recognise progress without overstating the comparison.
2026 new patients by month
January to September from the clinic’s new-patient tracker (workbook and register agree).
The quarter
New patients held at 41 in July and 41 in August, then eased to 25 in September — 107 across the quarter.
Compared with last year
July: 41 vs 39. August: 41 vs 34. September: 25 vs 50 (−50%). The quarter totals 107 vs 123 last year.
The year so far
January–September 2026: 380 new patients. September 2026 is the lowest month in the available 2024–2026 records.
What this means for your clinic
July and August held their ground against last year. September is the month to understand — the enquiry and call figures below show demand was still arriving, which makes enquiry outcomes and follow-up worth reviewing. The available figures do not attribute individual new patients to a specific channel.
January–September new-patient comparison
| Year | Jan | Feb | Mar | Apr | May | Jun | Jul | Aug | Sep | Jul–Sep Total | Jan–Sep |
|---|---|---|---|---|---|---|---|---|---|---|---|
| 2024 | — | — | — | — | — | — | 48 | 47 | 37 | 132 | — |
| 2025 | 46 | 32 | 41 | 33 | 25 | 39 | 39 | 34 | 50 | 123 | 339 |
| 2026 | 56 | 44 | 38 | 62 | 33 | 40 | 41 | 41 | 25 | 107 | 380 |
September 2026 welcomed 25 new patients, against 50 in September 2025 and 37 in September 2024. All figures come from the clinic’s new-patient tracker (workbook and register agree). January–June 2024 were not recorded, so no 2024 January–September total is shown — a blank month means not recorded, not zero.
04
Marketing content
Real clinic photography, built into content patients recognise.
Your content library grew with real photography from your own rooms — no stock, per your brief. Finished graphic sets and video thumbnails landed in July, and your offers landing page carried almost all Google Ads visits. No finished reels were delivered inside July–September; the quarter’s video files are raw shoot footage.
Reels
No finished reels in July–September. Video files added in this window are raw shoot footage from your rooms (15 July), kept as source material — not published reels. Your brief asks for your own photos and videos only, which this footage supports.
Graphics
Thumbnail
Full Arch Implants (older-video thumbnail)
Client-requested thumbnail · July 2026.
Open file →Landing pages

Landing page
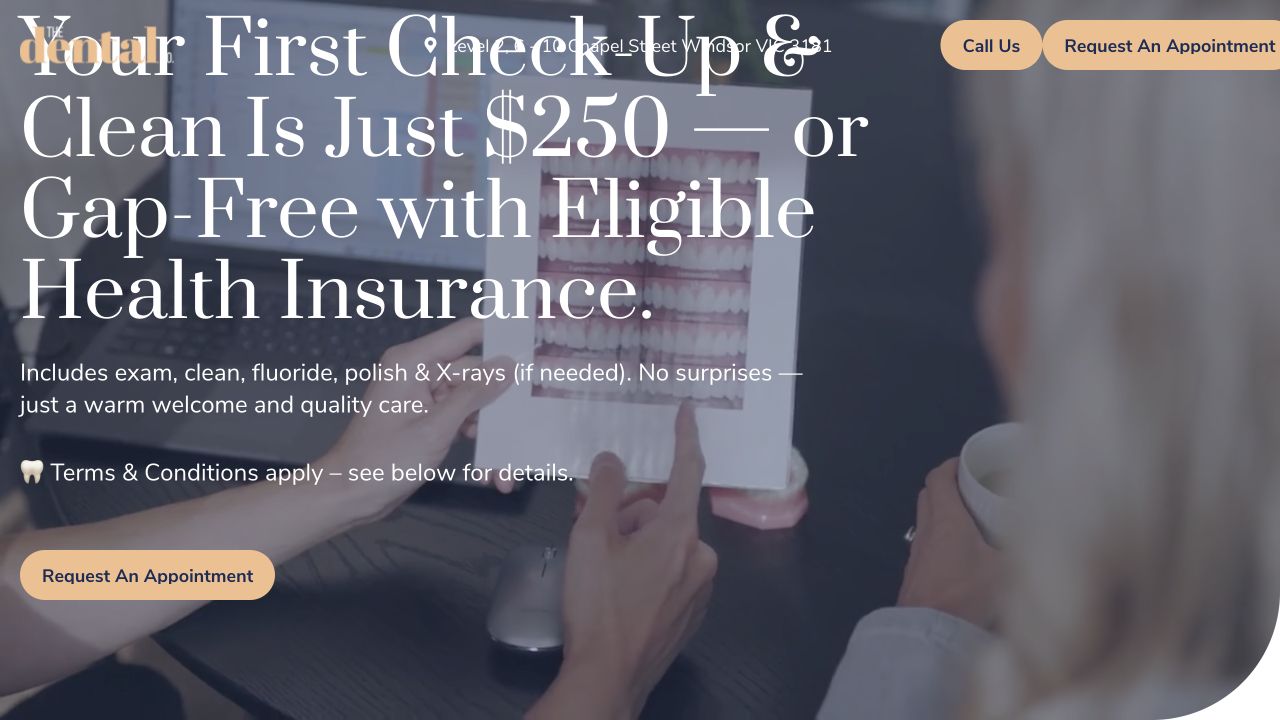
Offers Landing Page
329 of 461 Google Ads clicks and 77 of 94 recorded actions this quarter.
Open landing page →05
Business results
A closer look at your clinic’s progress.
107 new patients across the quarter, 134 treatments completed and 188 enquiries recorded. Here is how the three months compare.
July + August + September · Your clinic’s result
107
New patients recorded
More people choosing The Dental Co. for their care.
Steady at 41 in July and August
July41
August41
September25
Completed treatments
134
Treatments completed
Jul 46Aug 54Sep 34
Treatments marked complete in your enquiry system, with $74,908 recorded value.
Patient interest
188
Recorded patient enquiries
Jul 83Aug 49Sep 56
New enquiries entered in your enquiry system (GHL).
Google advertising
94
Actions through Google Ads
Jul 35Aug 34Sep 25
Appointment requests and call actions, not confirmed new patients.
Social advertising
2,624
Link clicks through Meta ads
Jul 1,362Aug 1,047Sep 215
People who tapped through to your website from Meta ads.
Phone response
477
Calls connected
Jul 195Aug 164Sep 118
Connected calls of 488 received. 11 went unanswered across the quarter.
Each measure shows a different part of the picture. These totals are reported separately and should not be added together.
From enquiry to treatment
How recorded enquiries became completed treatments, by month. New-enquiry and completed-treatment counts come from your enquiry system; new-patient counts come from the clinic tracker.
| Measure | July | August | September | Quarter |
|---|---|---|---|---|
| New enquiries recorded | 83 | 49 | 56 | 188 |
| … of which from your Maps listing | 62 | 30 | 41 | 133 |
| … of which from Google Ads | 19 | 14 | 12 | 45 |
| Treatments completed | 46 | 54 | 34 | 134 |
| … new patients among them | 9 | 15 | 10 | 34 |
| Recorded treatment value | $21,909 | $26,659 | $26,340 | $74,908 |
| Still open at month’s move | 38 | 23 | 48 | 109 |
Google Ads spend per new patient reaching treatment was $670 for the quarter ($8,713 of Google spend ÷ 13 new patients recorded as Google Ads and marked treatment complete). Most completed treatments were returning patients (99 of 134) — the ads figure above counts new patients only. Treatment values are recorded in your system, not banked revenue.
06
Patient calls
How your team handled patient calls.
Calls are one of the clearest signals of patient interest. This is what your phone system recorded across July, August and September — how many connected, how many were missed, and which line they rang on.
Patient calls, July to September
Reconstructed from your phone system records. 488 call events grouped into 466 distinct attempts (a call can log on two lines); the table counts received events.
488Call events
98% of calls connected
Across July–September, your team connected 477 of 488 recorded call events. The 11 missed or unanswered calls make up the small remaining slice.
Connected477
Missed or unanswered11
| Measure | July | August | September | Quarter |
|---|---|---|---|---|
| Calls received | 203 | 164 | 121 | 488 |
| Connected | 195 | 164 | 118 | 477 |
| Missed or unanswered | 8 | 0 | 3 | 11 |
| Distinct callers | 150 | 121 | 95 | 334 |
| Calls on your listing line | 187 | 151 | 113 | 451 |
| Calls on your Google Ads line | 9 | 3 | 3 | 15 |
| Calls on the number-pool line | 6 | 10 | 5 | 21 |
| Average connected length | 1m 51s | 1m 53s | 1m 50s | 1m 51s |
Your team connected 477 of 488 calls (98%). A first-time-caller split is not reported: older phone history sits outside the available records, so every retrieved caller would look new. Distinct-caller counts are reported instead.
Answered CallsTeam Effort
Almost nothing rang out — 98% connected.
Your team connected 195 of 203 calls in July, all 164 in August and 118 of 121 in September. The 11 missed call events are worth checking for returned calls before arranging any callbacks.
Calls From AdvertisingPaid Response
451 calls reached your listing line.
That is 92% of all calls across the quarter — your Maps listing is what makes the phone ring. The ads line carried 15 calls and the number-pool line 21.
07
Channel performance
How your marketing supported discovery and enquiry.
Search, social and website data give us useful signals about where interest is coming from. Where a channel’s reporting is incomplete, we have made that clear rather than estimating its contribution.
Where discovery came from
Website-visit analytics are not connected for your site, so visits are not reported here. These are the discovery signals we can verify from your advertising platforms and phone system.
2,624
Taps to your site from Meta ads (Jul–Sep)
461
Clicks from Google Ads (Jul–Sep)
1,483
Meta ad landing-page views (Jul–Sep)
451
Calls on your listing line (Jul–Sep)
Each measure comes from a different system and they should not be added together. Connecting website analytics would complete this picture — worth discussing.
Google AdsSearch Advertising
Google search ads generated 94 recorded actions on 461 clicks.
Spend was $3,003 in July, $2,792 in August and $2,918 in September ($8,713 combined). September cost more per action ($117 vs about $82–86) as clicks fell from 159 to 95 at flat spend. These are advertising actions — mainly appointment requests and call taps — rather than confirmed new patients.
Meta AdsSocial Advertising
Meta ads drove 2,624 link clicks on $815 of spend.
July recorded 1,362 link clicks, August 1,047 and September 215, across 255,564 impressions. Two traffic campaigns carried the quarter: “Lofi Ad Ideas” spent $312 in July and $122 in August before pausing, while the Windsor room-for-rent campaign spent $156, $154 and $70 across the three months. No leads were recorded by Meta in this period — these campaigns are designed to put your clinic in front of locals and drive website visits.
Website & SearchLargest Sources
Your offers page does the converting.
The offers landing page carried 329 of 461 Google Ads clicks and produced 77 of 94 recorded actions. The implants page ($490) and payment-options anchor ($584) drew clicks but no recorded actions — worth reviewing what those visits meet.
What people searched to find you (Google Ads)
The search terms that triggered your ads in July–September 2026 (top terms shown; hidden queries make up the rest).
| Search term | Clicks | Spend | Recorded actions |
|---|---|---|---|
| dentist near me | 152 | $2,469 | 21 |
| dentist prahran | 40 | $891 | 16 |
| dentist | 30 | $592 | 4 |
| dental clinic near me | 15 | $337 | 6 |
| emergency dentist | 8 | $260 | 0 |
| emergency dentist near me | 7 | $258 | 3 |
| dentist windsor | 17 | $243 | 11 |
| dentists near me | 8 | $152 | 5 |
“Dentist near me” drew the most clicks and $2,469 of spend (28% of the quarter). Suburb terms (“dentist prahran”, “dentist windsor”) converted well when they clicked — 27 recorded actions between them.
Where ad visitors landed
Landing pages recorded by Google Ads in July–September 2026.
| Landing page | Clicks | Spend | Recorded actions |
|---|---|---|---|
| /offers-landing-page/ | 329 | $6,125 | 77 |
| …/offers-landing-page/#paymentoptions | 22 | $584 | 0 |
| /dental-implants-landing-page/ | 46 | $490 | 0 |
| /emergency-dentist/ | 9 | $392 | 2.5 |
| …/offers-landing-page/#patient-offers | 7 | $250 | 5 |
| …/offers-landing-page/#ourteam | 7 | $81 | 1 |
| …/offers-landing-page/#whyus | 1 | $13 | 0 |
Nearly all ad visits landed on your offers page, which also produced most recorded actions. Fractional actions are Google’s attribution values, not whole patients.
08
Wins & opportunities
A quarter with real strengths, and one month to fix.
These are the results worth recognising and the opportunities we recommend acting on next.
Biggest WinNew Patients
134 treatments completed across the quarter.
August closed 54 treatments — your best month — and September held $26,340 of recorded treatment value even as new-patient counts dipped. That is a result worth recognising for your team.
Website GrowthMore Discovery
#1 on Maps for “dentist Windsor”.
A 4.9 rating from 308 reviews, top of the map for your suburb and #3 for wider searches. Listings-driven enquiries were 71% of all new enquiries this quarter.
Advertising ResponseCalls & Requests
94 recorded actions from Google Ads.
35 in July, 34 in August and 25 in September. Your offers page turned most of that interest into recorded actions — 77 of 94.
Biggest OpportunityFollow-Through
Review the 109 open enquiry records.
188 enquiries were recorded and 109 are still open, including 48 from September. Checking their booking and contact status alongside the 11 missed call events will show which people, if any, need follow-up.
Area To WatchWhere Visits Come From
Watch September’s two slides.
New patients fell to 25 and ad clicks to 95 while spend held flat — September cost $117 per recorded action against about $82–86 before. The implants campaign and page drew $1,093 of combined spend with no recorded actions.
09
Moving forward
Our next priorities, shaped around your clinic and your patients.
These are our recommended priorities for the next period. We would work through them with your team, keeping the process practical and the patient experience at the centre.
1
Review open enquiry outcomes.
Our recommended approach: Review the 109 records marked open, starting with September’s 48, and check the 11 missed call events for any returned calls. Prioritise Appointment Inquiries and Rescheduling cards, confirm whether each person has booked or already been contacted, then follow up where needed.
Why it matters: September closed 34 treatments while 48 September enquiry records were still marked open. Their status alone does not show whether a callback is needed.
Why it matters: September closed 34 treatments while 48 September enquiry records were still marked open. Their status alone does not show whether a callback is needed.
Aim →Clear booking status and timely follow-up where needed.
2
Review Google Ads performance and the planned pause.
Our recommended approach: Dr Justin requested a pause to Google Ads effective 29 September. Confirm the campaigns’ current status matches that plan. When discussing a future restart, review the implants campaign and page ($1,093 combined, no recorded actions) and the “dentist near me” share ($2,469, 28% of spend).
Why it matters: September clicks fell 40% while spend stayed similar. The quarter’s ad actions are not confirmed new patients, so campaign changes should be judged against verified enquiries and bookings.
Why it matters: September clicks fell 40% while spend stayed similar. The quarter’s ad actions are not confirmed new patients, so campaign changes should be judged against verified enquiries and bookings.
Aim →A pause that matches the agreed plan and better evidence for future budget decisions.
3
Restart publishing from your own photography.
Our recommended approach: Publish the two scheduled September carousels (aligners, veneers) and set a modest weekly rhythm from the July photo sets — your rooms, your team, your work, per your brief.
Why it matters: Most July–August board cards were cancelled and no successful post is recorded, while your publishing channels are connected and healthy. New photos are your most distinctive asset.
Why it matters: Most July–August board cards were cancelled and no successful post is recorded, while your publishing channels are connected and healthy. New photos are your most distinctive asset.
Aim →A living feed that matches the quality of the clinic.
4
Tidy the listing that brings most patients.
Our recommended approach: Review the Maps listing title — it reads “Prahran” while your address is in Windsor — and keep reviews coming (4.9 from 308 is excellent).
Why it matters: Your listing drives 71% of new enquiries and 92% of calls. A correct, strong listing is your highest-return asset.
Why it matters: Your listing drives 71% of new enquiries and 92% of calls. A correct, strong listing is your highest-return asset.
Aim →A listing that matches your door, collecting reviews.
Our focus for The Dental Co.
We want your marketing to support the clinic in a way that is useful to both your patients and your team. That means recognising the treatments you completed, being clear about September, and recommending a review of open enquiry records so any needed follow-up is clear.
We want your marketing to support the clinic in a way that is useful to both your patients and your team. That means recognising the treatments you completed, being clear about September, and recommending a review of open enquiry records so any needed follow-up is clear.